Simulation · DESY internship project

Burning through copper

A six-femtosecond X-ray laser pulse crosses a 20 µm copper foil. The simulation follows the atoms it ionises, and shows the metal getting darker the harder it is hit.

  • 8.05 keV photons
  • 40 µJ SASE pulse
  • 6 fs FWHM
  • focused to 180 × 220 nm
t = 48.0 fs · pulse 11.4 µm deep

Side view of one simulated shot. Gold is the X-ray pulse; its spiky texture is the shot noise of a real free-electron laser. Teal is the share of atoms ionised behind it. Depth runs left to right; the transverse axis is stretched 40×.

Scale20 µm of copper · 67 fs of travel

Light that leaves a wake

An X-ray free-electron laser packs about 3 × 10¹⁰ photons into a few femtoseconds. Focused onto copper, a photon can knock a deep core electron out of an atom and leave a hole in its 1s or 2p shell. The holes don’t last: in about a femtosecond an Auger decay fills them, throws out another electron, and leaves the atom more ionised.

The interesting part is what those ions do to the rest of the pulse. An atom with a 2p hole can absorb a photon at the copper Kα energy, which is exactly where this pulse is tuned, by lifting a 1s electron into the hole. A neutral atom can’t. So the front of the pulse creates 2p holes, and the back of the pulse meets a foil that absorbs more than it did a moment ago. This is reverse saturable absorption: instead of bleaching, the material gets more opaque as the intensity rises.

In the animation the pulse dims as it goes deeper, and the ionised wake fades with it: up to 36% of the atoms near the front surface, far fewer at the back. About a third of the pulse energy makes it out.

  • 0.44 fslifetime of a 1s hole
  • 8047.9 eVcopper Kα₁ line
  • 1.8 µmlength of the pulse inside the foil, ten times its width
Scale20 × 0.44 × 0.44 µm, sideways stretched 10×

The same shot, in the round

Volume render of the full x–y–z grid from a slowly orbiting camera. The wireframe is the simulated volume. Each point glows with the light or ionisation it holds, and the glow adds up along every line of sight.

At true proportions the beam would be a hair-thin needle: the pulse is about ten times longer than it is wide, and the foil is a hundred times thicker than the beam is wide. Stretching the two sideways axes makes it visible, along with the ionised channel it drills through the metal.

Scaleone point in the beam · 9 keV of atomic levels

Inside the atoms

Populations at the beam centre, 0.33 µm into the foil. Each level glows with the share of atoms in that state (log scale). The photoionisation arrows glow with the pulse; the Kα lines glow with the quantum coherence between the 1s and 2p holes.

The model tracks the density matrix of each ion, not just how many atoms sit in each state. Core-hole populations and the coherences between them evolve together with the X-ray field, so stimulated emission and resonant absorption at Kα come out of the same equations.

Around the main levels sit satellite copies: atoms that have already lost a 3d or 3p electron, whose Kα line is shifted by one to three electronvolts, still well inside the pulse’s 12 eV bandwidth. By the time the pulse has passed, 64% of the atoms at this spot are still neutral and 36% are ionised. The electrons freed along the way slow down through the metal and ionise more atoms as they go.

  • 8 levelsin the main density matrix: 1s, 2p₃/₂ and 2p₁/₂ hole sublevels
  • 7 satellite blocksfor ions with one or two spectator holes
  • 7 keV → 30 eVenergy ladder of the free electrons
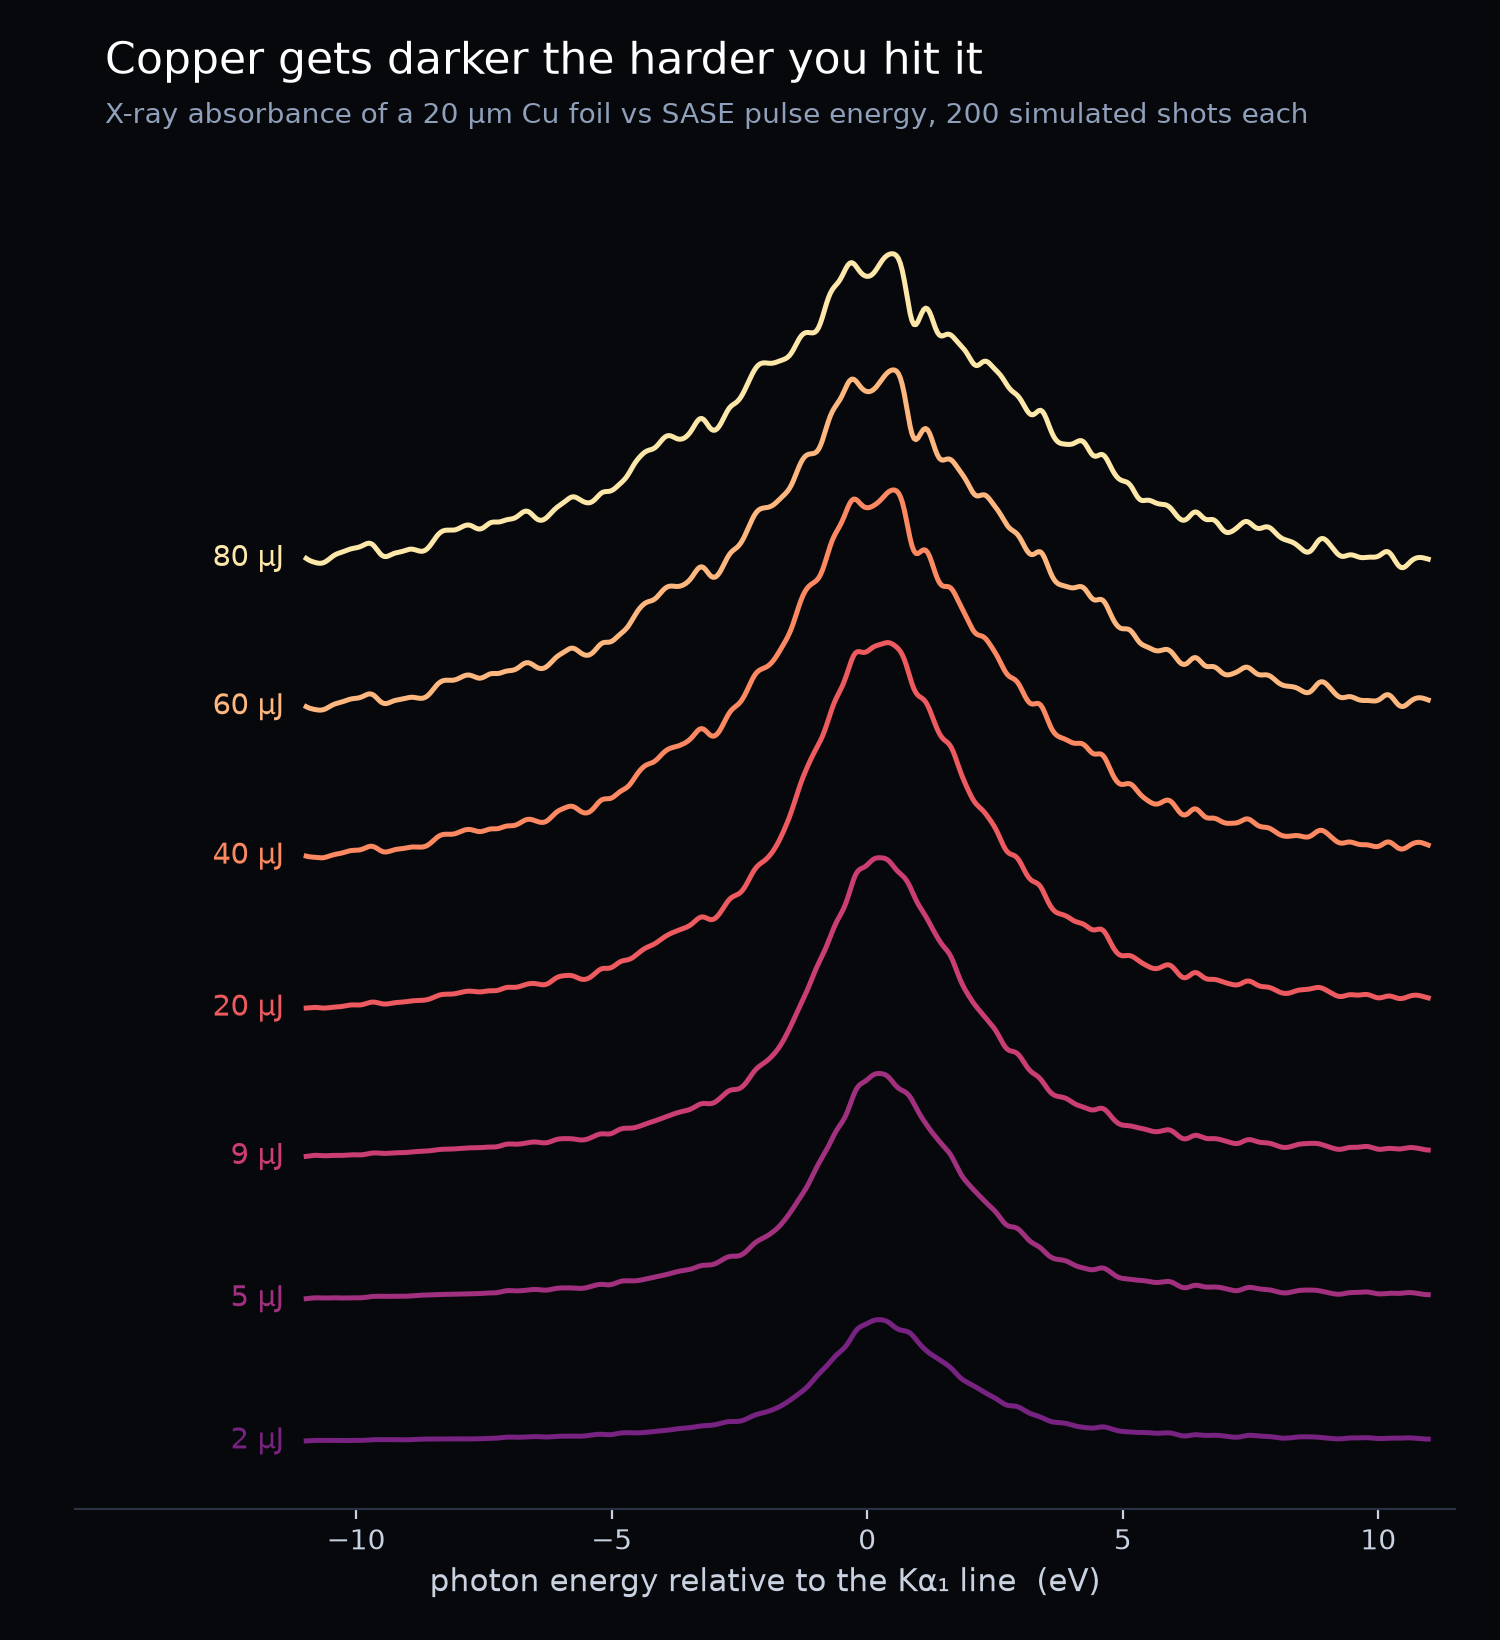
Stacked absorbance spectra for pulse energies from 2 to 80 µJ, with the peak at the Kα1 line growing and broadening as pulse energy rises

Absorbance across the pulse spectrum, averaged over 200 random SASE shots per pulse energy, from 2 µJ (bottom) to 80 µJ (top). Ridges are offset vertically; zero on the energy axis is the Kα₁ line.

Scale7 pulse energies × 200 shots

The harder you hit it, the darker it gets

Every free-electron-laser shot has its own spiky, random spectrum, so one shot on its own says little. Averaging 200 simulated shots per pulse energy leaves the trend underneath.

At low energy the foil absorbs a little more right at the Kα₁ line. As the pulse gets stronger it ionises more of the foil while it is still passing through, and that absorption peak grows and spreads out across the bandwidth.

Scale58.6 million grid points

How a shot is computed

The foil is cut into 61 slices along the beam. For each slice in turn, the code steps through the whole pulse 0.025 fs at a time, and at every step it does four things:

  1. Evolve the atoms

    Integrate every ion’s density matrix forward one time step (RK4), driven by the local X-ray field.

  2. Update the absorption

    Turn the new populations into an absorption coefficient for the field.

  3. Propagate the field

    Carry the field 333 nm deeper with an FFT Fresnel step, including diffraction and absorption.

  4. Add what the atoms emit

    Add the field radiated by the atomic coherences. This is where stimulated Kα emission enters.

↻ repeat for the next time step, then move to the next slice

Grid · t × x × y × z
1000 × 31 × 31 × 61
Resolution
0.025 fs · 16.7 nm · 333 nm
Atomic model
8 coupled density matrices
Pulse
SASE, generated with OCELOT
Compute
86 min, one process
Output
14.6 GB → 6.1 GB HDF5